Parabolas and Cubics
In this lesson we will learn about the graphs of equations of the form y = ax2 and y = ax3. We have see before that the graph of y = mx + b is the graph of a line. What happens if there is an x2 term in this expression? Let's first look at the simplest equation that has an x2 term.
Example 1
What is the graph of
y = x2
Solution
To graph this we can come up with some points. Lets make a T-table with the values of -3,-2,-1,0,1,2 for x.
We have
(-3)2 = 9 (-2)2 = 4 (-1)2 = 1
(0)2 = 0 (1)2 = 1 (2)2 = 4 (3)2 = 9
We can place these in the T-table.
| x | y |
| -3 | 9 |
| -2 | 4 |
| -1 | 1 |
| 0 | 0 |
| 1 | 1 |
| 2 | 4 |
| 3 | 9 |
This table gives us the points (-3,9), (-2,4), (-1,1), (0,0), (1,1), (2,4), and (3,9). Next, we plot these points on the xy-plane. Notice that all of these points have a nonnegative y-coordinate.
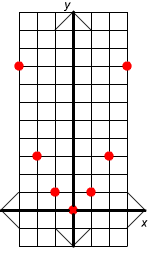
Finally, to graph this we can connect the dots with a smooth curve. The graph is shown below.
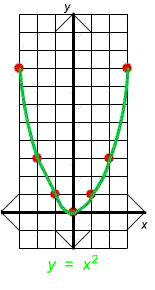
Notice that the graph stays above the x-axis. If you think of the y-axis as a mirror, then the right side of the graph is the same as the left hand side of the graph reflected across the y-axis. We see that the shape is a little like a smile. It is steeper far from the origin and less steep near the origin. We call this type of graph a parabola.
Now let's consider another example of graphing an equation that contains an x2.
Example 2
Sketch the graph of
y = -x2
Solution
We follow the same process as in Example 1.
Lets make a T-table with the values of -3,-2,-1,0,1,2 for x.
We have
-(-3)2 = -9 -(-2)2 = -4 -(-1)2 = -1
-(0)2 = -0 -(1)2 = -1 -(2)2 = -4 -(3)2 = -9
We can place these in the T-table.
| x | y |
| -3 | -9 |
| -2 | -4 |
| -1 | -1 |
| 0 | -0 |
| 1 | -1 |
| 2 | -4 |
| 3 | -9 |
This table gives us the points (-3,-9), (-2,-4), (-1,-1), (0,-0), (1,-1), (2,-4), and (3,-9). Next, we plot these points on the xy-plane and connect the points with a smooth curve. Notice that all of these points have a non-positive y-coordinate.
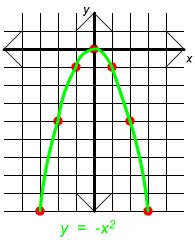
We see that this curve has the same shape, but is upside down like a frown. Casually, we call this a "frown parabola".
It turns out, that all graphs of equations of the form
y = ax2
where a is a nonzero number have the shape of a parabola. To determine is it looks like a smile or a frown follow the the principle:
If a > 0 the parabola looks like a smile
If a < 0 the parabola looks like a frown
Example 3
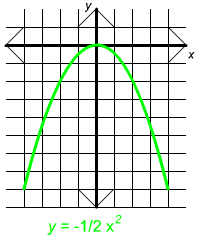
The graphs shown below are all graphs of parabolas. Notice that the equations that include a negative sign have graphs that are "frowns" while those without are "smiles"
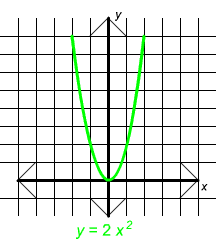
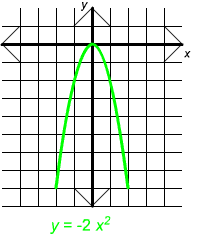
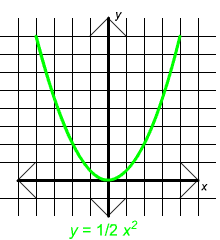
Now try one by yourself. If you want to see the answer, put your mouse on the yellow rectangle and the answer will appear.
Exercise 1
Which of the following could be the graph of y = -0.4 x2 for positive values of x?
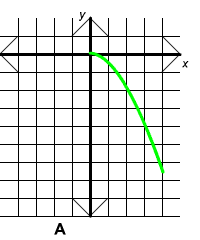
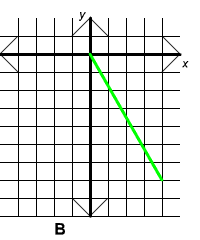
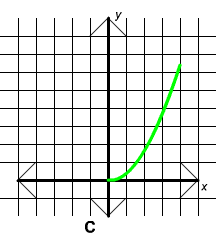
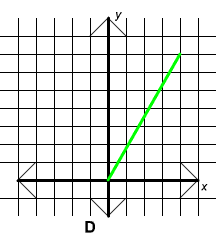
Answer
![]()
Now that we understand how to recognize the graphs of y = ax2, we will look at when we have a power of 3 instead of a power of 2. These graphs are called cubic curves and have the equation
y = ax3
Example 4
The graph of y = x3 is shown below.
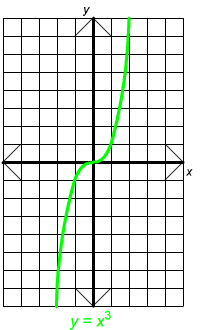
Notice that this graph starts low on the left, moves steeply upward, flattens out at the origin, and then moves steeply upward again. This description will apply to all graphs of equations y = ax3 with positive values of a.
Example 5
The graph of y = -x3 is shown below.
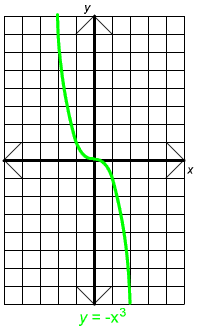
Notice that this graph is the same as the graph of y = x3 but upside down. In particular, on the left it starts high. Then it drops steeply until it levels off at the origin. Then it resumes its steep descent to the right of the origin. This description will apply to all graphs of equations y = ax3 with negative values of a.
Example 6
Below are a few more cubic graphs.
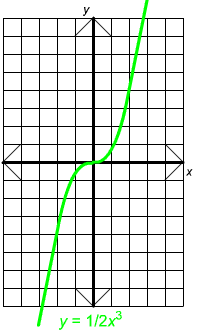
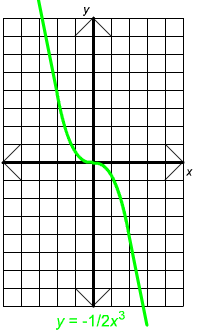
Notice that when the negative sign appears, the graph goes from top left to bottom right. Otherwise it goes from bottom left to top right.
Now try one by yourself. If you want to see the answer, put your mouse on the yellow rectangle and the answer will appear.
Exercise 2
Match the equation with its graph.
A. y = 1/3 x2 B. y = 1/3 x3
C. y = -1/3 x2 D. y = -1/3 x3
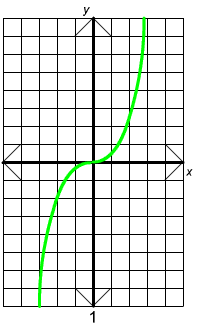
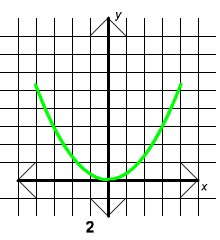
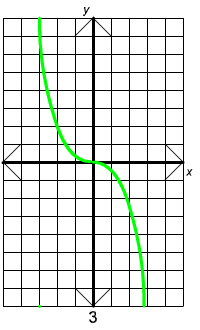
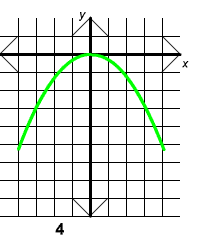
Answer
![]()