Math 201 Practice Final Key
Please work out each of the given problems. Credit will be based on the steps that you show towards the final answer. Show your work.
Problem 1
Match the following hypotheses and estimates with the appropriate test statistic or confidence interval. Explain your reasoning.
i) A confidence interval for a population mean.
ii) A confidence interval for a population proportion.
iii) A confidence interval for the difference between two independent population means
iv) A confidence interval for the difference between two population proportions.
v) A confidence interval for paired differences (dependent samples).
vi) A confidence interval for the value of y given a value of x using a regression line.
vii) A hypothesis test for a population mean.
viii) A hypothesis test for a population proportion.
ix) A hypothesis test for the difference between two independent population means
x) A hypothesis test for the difference between two population proportions.
xi) A hypothesis test for paired differences (dependent samples).
xii) Chi squared test for goodness of fit.
xiii) Chi squared test for independence.
xiv) Chi squared test for homogeneity
xv) 1-Way ANOVA
A. Are automobile prices higher in South Lake Tahoe then in Sacramento. Fifty Subaru Legacy's from the South Tahoe dealership and fifty from the Sacramento dealership were sold last month and recorded.
ix. There are two samples, each with continuous data and cannot be paired.
B. Does the color of the paper used for a final exam influence performance? 200 students were randomly given the same test on blue, red, and white paper. The number of A's, B's, C's, D's and F's for each color were tabulated.
xv. You are deciding whether two categorical variables (Color and Letter Grade) are related. If they are independent, then knowing a color does not give any indication on what the letter grade will be.
C. Is honey a better medicine for small wounds than conventional salves? Currently 9% of the wounds that are treated with conventional salves end up infected. 150 wounds in a study group were treated with honey.
viii. There is only one sample and the data is Boolean.
D. How much of food that you buy ends up being thrown out? A refrigerator was monitored that had 45 perishable items.
ii. The data is Boolean (either spoils or does not spoil) and there is only one sample taken.
E. How long can you expect to live if your cholesterol level is 230? Data has been taken from 45,000 people with varying levels of cholesterol.
vi. We are given a value for x (230) and are interested in y.
F. How much better has the NASDAQ done than the Dow Jones Industrial Average this year? The daily point gains and losses have been charted since January 2.
v. We have two sets of data that can be paired by date.
G. What are the low and high estimates for the number of Kokanee salmon that will run in Trout Creek this fall? Data has been collected over the last forty years.
i. There is one sample of a continuous random variable.
For additional practice go to:
http://www.ltcconline.net/greenl/java/Statistics/catStatProb/categorizingStatProblemsJavaScript.html
Problem 2 Answer the following True or False. For practice on this go to the following link and make sure all categories are checked.
http://www.ltcconline.net/greenl/java/Statistics/TrueFalse/statsTrueFalse.html
Problem 3 Your business is being investigated about unfair promotion practices with regard to race. Your policy is to promote 20% of your employees. Your current staff consists of 200 Caucasians, 45 Hispanics, 30 African Americans, and 25 classified as other. Below is a table that shows the number of employees that were promoted last year.
| Caucasian | Hispanic | African American | Other |
| 50 | 6 | 3 | 1 |
what can be concluded at the 5% level?
We perform a Chi square goodness of fit test. Our hypotheses are
H0: The population fits the given distribution
H1: The population has a different distribution
We find the expected counts by taking 20% of each: 40 Caucasians, 9 Hispanics, 6 African Americans, and 5 Others. We put the observed and expected into the calculator's L1 and L2 and go to the Goodness of Fit program to get
c2 = 8.2
P-Value = 0.04205
Since the P-Value is less than 0.05, we reject the null hypothesis and conclude that there is sufficient evidence to conclude that the true promotion distribution is not 20% of each racial group.
Problem 4 A certain model of car comes in a two-door version, a four door version, and a hatchback version. Each version can be equipped with either an automatic transmission or a manual transmission. The accompanying table gives the relevant proportions.
| TD | FD | HB | |
| A | 0.32 | 0.27 | 0.18 |
| M | 0.08 | 0.04 | 0.11 |
A customer who has purchased one of these cars is randomly selected.
A. What is the probability that the customer purchased a car with an automatic transmission? A four-door car?
P(A) = 0.32 + 0.27 + 0.18 = 0.77
P(FD) = 0.27 + 0.04 = 0.31
There is a 77% chance that the customer purchased a car with automatic transmission and a 31% chance that the customer purchased a car with four doors.
B. Given that the customer purchased a four door car, what is the probability that is has an automatic transmission?
We compute
P(A and
FD)
0.27
P(A|FD) =
=
= 0.87
P(FD)
0.31
If we know that the customer purchased a four door car, then there is an 87% chance that this car had automatic transmission.
C. Given that the customer did not purchase a hatchback, what is the probability that the car has a manual transmission?
We compute
P(M and not HB)
0.08 + 0.04
P(M|not HB) =
=
= 0.17
P(not HB)
0.08 + 0.04 + 0.32 + 0.27
If we know that the customer did not purchase a hatchback, then there is an 17% chance that this car had manual transmission.
D. If 8 cars were sold, where is the probability that exactly 6 of them were two doors with automatic transmission?
We solve this using the binomial distribution. We get
binompdf(8,0.32,6) = 0.0139
There is a 1.4% chance that exactly six of the cars had automatic transmission.
Problem 5 You want to construct a confidence interval for the
percent of registered voters who are planning on voting for the latest
environmental bill. You want to have a margin of error of
![]() 0.03.
0.03.
A. How many registered voters should you survey (use a = 0.05)?
Since we do not have a preliminary estimate we use the formula

We get

We should survey 1068 registered voters
B. Suppose that you conducted this survey (as in part A) and found that 52% of the respondents intended to vote for the latest environmental bill. Construct the appropriate 90% confidence interval. Interpret this interval. How would the Sierra Club respond to this confidence interval?
We have
z = 1.645 n = 1,068 x = (0.52)(1068) = 555
We enter this into a confidence interval test 1PropZInt to get
(0.49452, 0.54481)
We can conclude with 90% confidence that between 49% and 55% of all voters intend to vote for the latest environment bill. Since this interval contains numbers less than 50%, the Sierra Club should attempt to woo more voters.
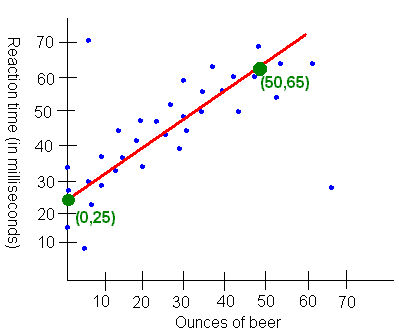
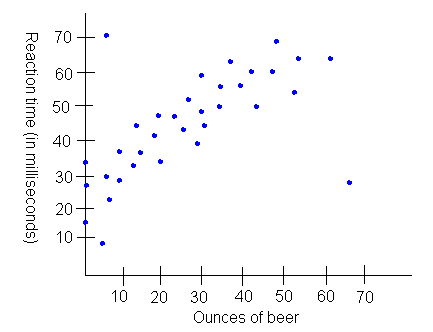
Problem 6 Data was collected to study the effect of alcohol on reaction time. Forty participants were given various amounts of alcohol and then took a test to see how many milliseconds it took to press a button upon seeing headlights. The scatter diagram is shown below.
A. Given an approximate equation of the regression line. Interpret the slope and the y-intercept.
First we eyeball the line. Then find two points on the line.

The y-intercept is about 25 and the slope is about
65 - 25
m =
= .8
50 - 0
The equation is
y = 25 + .8 x
The y-intercept tells us that without drinking any alcohol, the reaction time is about 25 milliseconds. The slope tells us that for every ounce of alcohol a person drinks, reaction time goes up by about 0.8 milliseconds.
B. Give an approximation of the correlation coefficient. Explain using a complete sentence why you chose this number.

The correlation is probably around 0.8 since the data generally follows a linear model, but not perfectly. Since the slope is positive, so is the correlation coefficient.
Problem 7
Twenty-five students took the first midterm exam. The number of minutes that they each took are shown below.
35, 45, 48, 50, 50, 52, 60, 61, 64, 70, 72, 75, 78, 78, 81, 83, 84, 87, 88, 88, 89, 90, 90, 90, 90
A. Construct a stem and leaf diagram for this data
We make a stem and leaf diagram with the stems representing the tens digit and the leaves representing the ones.
3
|| 5
4 || 5 8
5 || 0 0 2
6 || 0 1 4
7 || 0 2 5 8 8
8 || 1 3 4 7 8 8 9
9 || 0 0 0 0
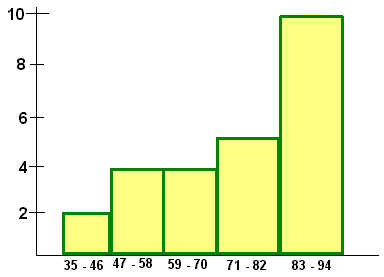
B. Construct a histogram for this data using 5 classes.
We find the class width by taking the range, dividing by 5 and increase the result to the nearest whole number.
90 - 35
+ 1 = 12
5
Next make a frequency distribution table
| Class Interval | Frequency |
| 35 - 46 | 2 |
| 47 - 58 | 4 |
| 59 - 70 | 4 |
| 71 - 82 | 5 |
| 82 - 93 | 10 |
The histogram is shown below

C. You took one hour to complete the exam. What is your percentile?
We are looking at the percentile that corresponds with 60 minutes. There are 6 times below 60. We calculate
6/25 x 100% = 24%
You are in the 24th percentile.
D. What is the mode?
Solution The mode is the value that occurs the most, namely 90.
E. If the student who took 35 minutes for the exam is disregarded, would the standard deviation decrease, increase, or stay the same. Explain.
Solution The standard deviation would decrease, since more of the data would fall closer to the mean.
Problem 8
A researcher is interested in finding out if there is a difference between the mean weights of female Freshmen, Sophomores, Juniors, and Seniors at the university level. The table below shows the results of a survey that was taken. What can be concluded at the 0.05 level of significance? What assumptions must be made in order to conduct this hypothesis test?
| Freshmen | Sophomores | Juniors | Seniors |
| 120 | 110 | 150 | 131 |
| 115 | 122 | 145 | 108 |
| 125 | 135 | 118 | 129 |
| 140 | 140 | 124 | 121 |
| 128 | 132 | 140 | 111 |
Solution
In order to test to see if there difference between several means, a 1-Way ANOVA is used. We have
H0: The population mean weight is the same for Freshmen, Sophomores, Juniors, and Seniors
H1: The population mean weight is different amongst at least two class levels.
We use the calculator's 1-Way ANOVA feature to
get
F = 1.54
P-Value = 0.2428
Since the P-Value is greater than the level of significance (0.24 > 0.05), we fail to reject the null hypothesis. There is insufficient evidence to support the claim that the population mean weight is not the same for Freshmen, Sophomores, Juniors, and Seniors.
The assumptions needed are:
Problem 9
A study was done to see if men are more likely than women to purchase at least one item when they go to the mall. 92 of the 120 men in the study purchased an item and 174 of the 260 women in the study purchased an item.
A. Conduct the appropriate hypothesis test and state your conclusion using a complete sentence using a level of significance of 0.10.
Solution
Since there are two samples and each survey questions is a Yes or No question, we conduct a hypothesis test for the difference between two proportions.
H0: p1 = p2
H1: p1 > p2
Where p1 is the proportion of men who purchase at least one item when they go to the mall and p2 is the proportion of women who purchase at least one item when they go to the mall. We conduct the hypothesis test with
x1 = 92 n1 = 120 x2 = 174 n2 = 260
We use the calculator's 2-PropZTest feature to get
z = 1.92
P-Value = 0.027
Since the P-Value is less than the level of significance (0.027 < 0.10), we can reject the null hypothesis and accept the alternative hypothesis. At the 10% level of significance there is statistically significance to conclude that men are more likely than women to purchase at least one item when they go to the mall.
B. The P-Value represents a probability. Interpret this probability in the context of the problem.
Solution
If the proportion of men and women who purchase at least one item when they go to the mall is the same, and if we conduct another survey of 120 men and 260 women, then there is a 2.7% chance that this new survey will result in at least 9.7% more men purchasing at least one item when they go to the mall than women.
C. The level of significance represents a probability. Interpret this probability in the context of the problem.
Solution
If the proportion of men and women who purchase at least one item when they go to the mall is the same, and if we conduct many more surveys of 120 men and 260 women, then 10% of these surveys will falsely lead to the conclusion that men are more likely than women to purchase at least one item when they go to the mall.
D. Was it appropriate to use the normal distribution for your calculations? Explain.
Solution
Yes since n1p1 = 92, n1q1 = 28, n2p2 = 174, and n2q2 = 86 are all greater than 5.
Problem 10
You decide to conduct a study asking 500 college students how many times a month they use the cafeteria.
A. Is the variable quantitative or qualitative?
Solution
A typical answer to the survey question "How many times a month do you use the cafeteria?" is say 6. Since this is a number, the variable is quantitative.
B. Describe how you would select your participants if you wanted to use the method of cluster sampling.
Solution
Randomly select many classes until the total student count for these classes is 500. Then go to each of these classes and conduct the survey making sure that every student from the selected classes answers the survey question.
C. Suppose you know that the distribution is approximately normal and the mean was 12.1 and the standard deviation was 3.5. What does the Empirical rule tell you about one standard deviation from the mean?
Solution
We calculate
12.1 - 3.5 = 8.6
12.1 + 3.5 = 15.6
The Empirical rule states that 68% of the data lies within 1 standard deviation from the mean. Thus 68% of the 500 college students who answered the survey go to the cafeteria between 8.6 and 15.6 (9 and 15) times per month.