Practice Midterm
Problem 1 Please answer the following True or False
To view a plethora of these problems, please go to the link below and check "Descriptive Statistics", "Probability" and "Confidence Intervals and Z" and "Hypothesis Testing".
http://www.ltcconline.net/greenl/java/Statistics/TrueFalse/statsTrueFalse.html
Problem 2 Five percent of all university students are math majors.
A. If 80 randomly selected college students are surveyed, what is the exact probability that at least 6 of them will be math majors.
Solution
This is a binomial experiment since the survey question is "Yes" or "No" and the trials are independent. The cast of characters is
n = 80 p = 0.05 x = 6
We want
P(x > 6) = 1 - P(x <5)
We can put this into the calculator as
1 - binomcdf(80,0.05,5) = 0.210775
Or we can say that there is about a 21% probability that at least 6 of the randomly selected college students will be math majors.
B. Could you have used the normal distribution to approximate the binomial distribution for part A.
Solution
No, since np = (80)(0.05) = 4 is less than 5.
Problem 3
Your tire company's snow and mud tires have an average lifetime of 80,000 miles with a standard deviation of 10,000 miles. Answer the following assuming the distribution is normal.
A. If the current guarantee for the tires is 65,000 miles, about what percentage of the tires will wear out before the guarantee expires?
Solution
Problem 3
Your tire company's snow and mud tires have an average lifetime of 80,000 miles with a standard deviation of 10,000 miles. Answer the following assuming the distribution is normal.
A. If the current guarantee for the tires is 65,000 miles, about what percentage of the tires will wear out before the guarantee expires?
First find the cast of characters. We have
m = 80000 s = 10000
We want the probability P(x < 65000).
Sketch the picture as shown below
In your TI 83/84 calculator, put in
normalcdf(-99999,65000,80000,10000) = 0.0668
We can say that about 6.7% of the tires will wear out before the guarantee expires.
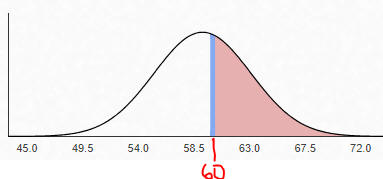
B. You want to reconsider the guarantee so that about 98% last past the guarantee period. What should you set as the guarantee period on your tires?
This problem asks us to go backwards. We want to find y such that
P(x > y ) = 0.98.
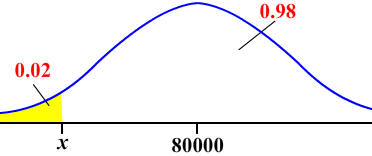
The picture shows that we need to subtract from 1. We find instead
P(x < y) = 0.02
Since we are going backwards, we are finding the inverse normal. In the calculator, enter
invNorm(0.02,80000,10000) = 59462
We should offer a 59,462 (or about a 60,000) mile guarantee so that about 98% of the tires will last past the guarantee period.
Problem 4
The Lake Tahoe Visitor's Authority has determined that 65% of the tourists who come to the Lake Tahoe area to go snowboarding are from the Bay area. The Boarder Motel has all of its 35 rooms booked during this weekend.
A. Use the normal distribution to estimate the probability that between 20 and 25 of the rooms host bay area visitors?
We first find the mean and standard deviation. The formula gives
m = np = (35)(.65) = 22.75
and
![]()
The continuity correction tells us that we want to find
P(19.5 < x < 25.5)
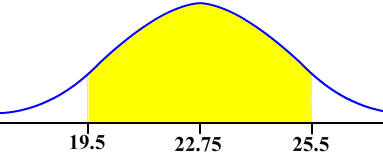
The picture indicates that we need to find the area between 19.5 and 25.5. Use the calculator to get
normalcdf(19.5,25.5,22.75,2.82) = 0.7107023161
We can conclude that there is about a 71% chance that between 20 and 25 of the visitors will be from the Bay Area.
B. Why is your estimate valid?
Solution
We compute np and nq. We have
np = 35(.65) = 22.75 nq = 35(.35) = 12.25
since both of these value are greater than 5, we can conclude that the distribution is approximately normal and our calculations are valid.
Problem 5
Explain what the difference is between a sampling distribution and the distribution of a sample.
Solution
A sampling distribution is the distribution of all possible samples of a fixed size taken from a population, while the distribution of a sample is the results that occur from only one individual sample that was taken.
Problem 6
It is known that the mean number of houses a Trick-Or-Treater visits is 46 and the standard deviation is 8.
A. Assuming that the distribution is approximately normal, what is the probability that your seven year old neighbor will visit fewer than 42 houses on Halloween?
We have
m = 46 s = 8
We want P(x < 42).
The picture shows that we need to put into our calcualtor
normalcdf(-99999,42,46,8) = 0.3085375322
We can conclude that there is about a 31% chance that the child will visit fewer than 42 houses.
B. 25 children were randomly selected and observed. What is the probability that their mean number of visits is between 48 and 55?
Solution
For this problem, we need to use the sampling distribution with sample size 25. We have
We want
![]()
as the picture below shows
We use the calculator to find
normalcdf(48,55,46,1.6) = 0.1056498297
We can concluded that there is about an 11% chance that mean number of trick-or-treaters will visit between 48 and 55 houses.
Problem 7
Do you favor allowing pilots to carry a gun in the cockpit? 74% of Americans are in favor of allowing pilots to carry a gun in the cockpit.
A. 80 passengers board a plane heading toward New York. What is the probability that the greater than 75% of them favor allowing the pilot to carry a gun? Use the normal approximation to work this problem out.
Solution
First notice that 75% of 80 is
x = (0.75)(80) = 60
We want to find the probability
P(x > 60)
We calculate the mean and standard deviation as
![]()
![]()
The picture is shown below
We put in the calculator
normalcdf(60,99999,59.2,3.923) = 0.4192
We can conclude that there is about a 42% chance that more than 75% of the passengers favor allowing the pilot to carry a gun.
B. Is the normal approximation valid? Explain.
Yes, since
np = 60 > 5 and nq = 20 > 5
Problem 8
The manager of Wasabi restaurant tallied the number of customers that he received over a 50 day period. He found that the mean number per day for this period was 45 with a standard deviation of 8.
A. Construct a 95% confidence interval for the true mean.
Solution
First find the cast of characters:
![]()
Now put it into the calculator's TInterval to get: (42.726,47.274)
B. Write a sentence that explains your findings.
Solution
We can be 95% confident that the mean number of customers at Wasabi throughout the entire year is between 42.7 and 47.3.
C. Explain what it means in the context of this study to be 95% confident.
Solution
If many collections of 50 days of customer totals are looked at, different confidence intervals for each would be calculated. 95% of these confidence intervals would contain the true mean customer count for all days. 5% would not contain this mean.
D. Was it necessary to make any assumptions about the underlying distribution of the population? Explain.
Solution
No, we do not need to assume normality since n > 30.
Problem 9
Thirteen black bears in the Sierra Nevada Mountains were captured and released for a research project. Their mean weight was found to be 320 pounds with a standard deviation of 23 pounds.
A. Determine a 95% confidence interval for the mean weight of black bears in the Sierra Nevada Mountains.
Solution
First find the cast of characters:
![]()
B. Write a sentence that explains your findings.
Solution
We can be 95% confident that the mean weight of all black bears in the Sierra Nevada Mountains is between 306 and 334 pounds.
C. Explain what it means in the context of this study to be 95% confident.
Solution
If many collections of 13 black bears from the Sierra Nevada Mountains are weighed, different confidence intervals for each would be calculated. 95% of these confidence intervals would contain the true mean weight of all black bears in the Sierra Nevada Mountains. 5% would not contain this mean.
D. Was it necessary to make any assumptions about the underlying distribution of the population? Explain.
Solution
Yes, since the sample size is smaller than 30, we must assume that the distribution of weights of black bears in the Sierra Nevada Mountains are normally distributed.
Problem 10
A psychologist is doing research on blindly following orders. 200 volunteers were ordered to push a button that would inflict 50 volts of electricity into a laboratory animal. 35 of them refused to push the button.
A. Construct a 90% confidence interval for the true proportion of people who will refuse to zap the animal.
Solution
We first find the cast of characters:
n = 200, x = 35, cLevel = .90
Now put it into the calculator's 1-PropZInt to get: (0.13081,0.21919)B. Write a sentence that explains your findings.
Solution
We can be 90% confident that between 13% and 22% of all people would refuse topush a button to inflict 50 volts of electricity into a laboratory animal if ordered to.
C. Explain what it means in the context of this study to be 90% confident.
Solution
If many groups of 200 people are tested to see if they would refuse to push the button, different confidence intervals for each would be calculated. 90% of these confidence intervals would contain the true proportion of people who would refuse to push the button when ordered. 10% would not contain this proportion.
D. Was it necessary to make any assumptions about the underlying distribution of the population? Explain.
No, since npHat = 35 > 5 and nqHat = 165 > 5.
Problem 11
Nationally, 2% of the population carry a venereal
disease. You are interested in constructing a 95%
confidence interval for the proprotion of carriers in the Tahoe Basin.
How many people will you need to test if you want a margin of error of
![]() 1%?
1%?
Solution
First find the cast of characters to find the sample size given a preliminary estimate for p.
p = 0.02, q = 0.98, E = 0.01, z = .196 (corresponds to a cLevel of .95)
Now plug it into the formula.
So we need to survey 753 people.
Problem 12
Your burger joint just sent out a coupon for fifty cent burgers. Your research has shown that 20% of coupon bearing customers just purchase a burger resulting a a loss to your restaurant of $0.25, 30% of coupon bearing customers also purchase fries with their burger resulting in a profit of $.50, and the rest opt for the full meal of a burger fries and a drink resulting in a profit of $1.50.
A. Write down a probability distribution table for the indicated distribution.
Solution
| x | P(x) |
| -0.25 | 0.2 |
| 0.50 | 0.3 |
| 1.50 | 0.5 |
B. Find the expected value and standard deviation.
We can do this using the list and stat feature on the calculator. The calculator gives a mean of 0.85 and a standard deviation of 0.7.
C. Use a complete sentence to interpret the expected value in the context of the question.
If many customers visit the burger joint, then the average profit per customer will be about 85 cents.
Problem 13
Thirteen males and fourteen females participated in a study leg strength. Right leg strength (in Newtons) was recorded for each participant resulting in the table below. Is there a difference between strength in men and women? Use a 5% level of significance. Give the P-value and interpret what it means. State any assumptions needed.
| Gender | n | x | s |
| Male | 13 | 2127 | 513 |
| Female | 14 | 1643 | 446 |
There are 2 samples given, the survey question is quantitative so it is for means, the samples are independent, and the population standard deviation is unknown so we use the Student's T-Distribution. Since we want to see if there is a "difference" this is a two tailed test. The null and alternative hypotheses are:
H0: m1 = m2
H1: m1 ≠ m2
We use the calculator with 2-SampTTest with STATS to get
t = 2.60758
P-Value = 0.015
Since the P-Value is less than the level of significance (0.05), we reject the null hypothesis and accept the alternative hypothesis. At the 5% level of significance, there is sufficient evidence to conclude that the mean leg strength for men is not the same as the mean leg strength for women. If the leg strength's were the same and another study was done with sample sizes 13 Males and 14 Females, then there would be a 1.5% chance that that study would result is the difference between male and female leg strength being at least as large as 484. Since the sample sizes are less than 30, we must assume that both populations' distributions are approximately normal.
Problem 14
A study was done to see if Caucasians have a lower pass rate than Latinos in their statistics class. 192 Caucasians and 83 Latinos were considered. 135 of the Caucasians and 65 of the Latinos passed the course.
A. Conduct the appropriate hypothesis test and state your conclusion in the context of the problem using a 0.05 level of significance.
Solution
Since the survey question, "Did you pass your statistics class?" is a Yes or No question, and since there are two samples, and since we want to see if the pass rate for Caucasians is lower than the Latino pass rate, we have
H0: p1 = p2
H1: p1 < p2
We use the calculator with 2-PropZTest. We get
z = -1.37
P-Value = 0.0857
Since the P-Value is greater than the level of significance, there is insufficient evidence to conclude that the pass rate for all Caucasians is lower than the pass rate for all Latinos.
B. Find the appropriate 95% confidence interval and explain in a complete sentence what it means.
Solution
We use the calculator with a 2-PropZInt to get
(-0.1897,0.02971)
Since the interval contains both negative and positive values it is likely that Caucasians have a higher pass rate than Latinos and it is also likely that Caucasians have a lower pass rate than Latinos. Therefore we cannot say whether the Caucasian's pass rate is lower than the Hispanic's pass rate.
Problem 15
A biologist measured the muscle masses in grams of ten laboratory rats before and after putting them on a high protein diet to see if the mean muscle mass increases with high protein diet. The results are shown in the table below.
| Before | 4 | 6 | 2 | 3 | 4 | 5 | 3 | 2 |
| After | 5 | 8 | 3 | 3 | 5 | 4 | 5 | 4 |
A. What can be concluded at the 0.05 level of significance?
Solution
Since each rat is measured before and after the diet, this is a two sample test with paired (dependent) samples. We put the data into L1 (Before) and L2 (After) and then store the differences into L3:
L1-L2 STO -> L3
Since the population standard deviation is unknown, we use a T-Test to get
T = -2.65
P-Value = 0.0166
Since the P-Value is less than 0.05, there is sufficient evidence to conclude that the mean muscle mass of all rats after being given the high protein diet is larger than to mean muscle mass before being given the high protein diet.
B. Construct and interpret the appropriate 95% confidence interval.
Solution
We use a T-Interval to get
(-1.894,-0.1063)
With a 95% level of confidence we can conclude that the mean muscle mass of all rats on the protein diet is between 0.1 g and 1.9 g more than the mean muscle mass for all rats without the high protein diet.
Problem 16
The fifteen year survival rate for prostrate cancer is 76%. A medical researcher has developed a new technique to treat prostrate cancer and has conducted a study on 250 randomly selected men with prostrate cancer who had this new very painful treatment. Fifteen years after the treatment 210 of these men were still alive. The researcher wants so find out of the treatment increases the survival rate.
A. State the Null and Alternative Hypotheses.
Solution
H0: p = 0.76
H1: p > 0.76
B. State the repercussions of a Type I error in the context of this study.
Solution
A Type I error means to reject the null hypothesis when the null hypothesis is true. In this case, that means decide that the survival rate is higher with the treatment when in fact it isn't. The treatment will end up becoming common practice when it doesn't work. Countless men will end up going through this painful treatment when in fact it does nothing to help them.
C. State the repercussions of a Type II error in the context of this study.
Solution
A Type II error means to fail to reject the null hypothesis when in fact it is false. In this case, this means that there is no evidence to show that the survival rate is higher when in fact it is. The treatment will be rejected by the FDA and more men will die because this treatment will not be given to them.
D. Sketch the Rejection Region with a level of significance of 0.05.
Solution
This is a right tailed test. The z-critical value is 1.645 (using invNormal(0.95) )The Rejection Region is shown below.
E. Calculate the test statistic and P-value
Solution
We can use our calculator using the 1-PropZTest with
p0 = 0.76, x = 210, n = 250 and "> p0"
The test statistic is z = 2.9617 and the P-value is p = 0.00153 and pHat = 0.84.
F. Use a complete sentence to state your results using a level of significance of 0.05 in the context of the question.
Solution
With a level of significance of 0.05, there is statistically significant evidence to conclude that for all men with prostrate cancer who receive the treatment the survival rate is higher than 76%.
G. The level of significance of 5% represents a probability. State what this represents in the context of the study.
Solution
If the treatment does not change the survival rate at all, and if many such studies were done with 250 men with prostrate cancer receiving this treatment, then 5% of these studies would end up falsely concluding that men with prostrate cancer do have a higher survival rate under this new painful treatment.
H. The P-Value that you obtained represents a probability. State what this represents in the context of the study.
If the treatment does not change the survival rate at all, and if many such studies were done with 250 men with prostrate cancer receiving this treatment, then only 0.153% of these studies would result in the survival rate for their samples of men to be greater than 84%.
Problem 17
Suppose the mean number of nights that Americans stay in hotels and motels per year is 7.9 and the standard deviation is 3.1. A researcher wants to see if this number is different for people who live in South Lake Tahoe. She surveys 12 randomly selected South Lake Tahoe residents. Assume the underlying distribution is approximately normal. The results of the survey are shown below:
0, 2, 4, 5, 5, 7, 7, 8, 8, 9, 10, 14
Perform the relevant hypothesis test using a level of significance of 0.05 and state your conclusion in the context of the survey.
Solution
First state the null and alternative hypotheses:
Next sketch the picture which is shown below.
Now enter the data into the L1 in the calculator. Since the standard deviation is known, we can use the z-test. Be sure to indicate that Data has been inputted instead of stats. The calculator gives
z = -1.47 p = 0.1412068365
In particular, since p < 0.05 we fail to reject the null hypothesis. There is insufficient evidence at the 0.05 level of significance to make a conclusion about the mean number of nights that South Lake Tahoe locals stay in hotels and motels per year differs from the national average.
Problem 18
A study was done to determine if the average student get less than the average recommended daily amount of sleep of 8 hours. The 35 randomly selected students surveyed received an average of 7.6 hours of sleep and their standard deviation was 1.7 hours. Conduct the relevant hypothesis test using a level of significance of 0.10 and state your conclusion in the context of the survey.
Solution
First state the null and alternative hypotheses.

Next sketch the picture which is shown below
Since the population standard deviation is unknown, we need to us the Student's T-Distribution (T-Test on the calculator). Now use the calculator with
![]()
This gives us a t-statistic of -1.392018772 and a P-Value of 0.086478038.
In particular, since P < 0.10, we can reject the null hypothesis and accept the alternative hypothesis. There is statistically significant evidence to conclude at a 0.01 level of significance that students on average get less than 8 hours of sleep per day.
Problem 19
Twenty students were asked how far they travelled each day to get to the college. Nineteen of the students all traveled between 0 and 7 miles, but one student lived in Sacramento and traveled 100 miles each day.
A. Which of the following would be changed significantly if the student from Sacramento had not been surveyed: mean, median, mode, standard deviation, variance, midrange?