Practice Exam II
Problem 1 Please answer the following True or False
To view a plethora of these problems, please go to the link below and check "Probability" and "Confidence Intervals and Z".
http://www.ltcconline.net/greenl/java/Statistics/TrueFalse/statTrueFalseWithChoices2.html
Problem 2
Your tire company's snow and mud tires have an average lifetime of 80,000 miles with a standard deviation of 10,000 miles. Answer the following assuming the distribution is normal.
A. If the current guarantee for the tires is 65,000 miles, about what percentage of the tires will wear out before the guarantee expires?
First find the cast of characters. We have
m = 80000 s = 10000
We want the probability P(x < 65000).
Sketch the picture as shown below
In your TI 83/84 calculator, put in
normalcdf(-99999,65000,80000,10000) = 0.0668
We can say that about 6.7% of the tires will wear out before the guarantee expires.
B. You want to reconsider the guarantee so that about 98% last past the guarantee period. What should you set as the guarantee period on your tires?
This problem asks us to go backwards. We want to find y such that
P(x > y ) = 0.98.
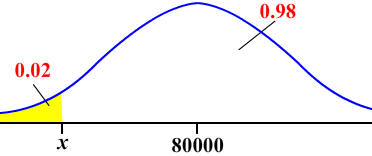
The picture shows that we need to subtract from 1. We find instead
P(x < y) = 0.02
Since we are going backwards, we are finding the inverse normal. In the calculator, enter
invNorm(0.02,80000,10000) = 59462
We should offer a 59,462 (or about a 60,000) mile guarantee so that about 98% of the tires will last past the guarantee period.
Problem 3
The Lake Tahoe Visitor's Authority has determined that 65% of the tourists who come to the Lake Tahoe area to go snowboarding are from the Bay area. The Boarder Motel has all of its 35 rooms booked during this weekend.
A. Use the normal distribution to estimate the probability that between 20 and 25 of the rooms host bay area visitors?
We first find the mean and standard deviation. The formula gives
m = np = (35)(.65) = 22.75
and
![]()
The continuity correction tells us that we want to find
P(19.5 < x < 25.5)
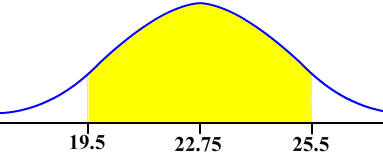
The picture indicates that we need to find the area between 19.5 and 25.5. Use the calculator to get
normalcdf(19.5,25.5,22.75,2.82) = 0.7107023161
We can conclude that there is about a 71% chance that between 20 and 25 of the visitors will be from the Bay Area.
B. Why is your estimate valid?
Solution
We compute np and nq. We have
np = 35(.65) = 22.75 nq = 35(.35) = 12.25
since both of these value are greater than 5, we can conclude that the distribution is approximately normal and our calculations are valid.
Problem 4
Explain what the difference is between a sampling distribution and the distribution of a sample.
Solution
A sampling distribution is the distribution of all possible samples of a fixed size taken from a population, while the distribution of a sample is the results that occur from only one individual sample that was taken.
Problem 5
It is known that the mean number of houses a Trick-Or-Treater visits is 46 and the standard deviation is 8.
A. Assuming that the distribution is approximately normal, what is the probability that your seven year old neighbor will visit fewer than 42 houses on Halloween?
We have
m = 46 s = 8
We want P(x < 42).
The picture shows that we need to put into our calcualtor
normalcdf(-99999,42,46,8) = 0.3085375322
We can conclude that there is about a 31% chance that the child will visit fewer than 42 houses.
B. 25 children were randomly selected and observed. What is the probability that their mean number of visits is between 48 and 55?
Solution
For this problem, we need to use the sampling distribution with sample size 25. We have
We want
![]()
as the picture below shows
We use the calculator to find
normalcdf(48,55,46,1.6) = 0.1056498297
We can concluded that there is about an 11% chance that mean number of trick-or-treaters will visit between 48 and 55 houses.
C. What is the probability that these 25 children visit a total of more than 1100 houses on Halloween?
Solution
This is a question that asks for the probability that the sum will be greater than 1000: P(S > 1100). The distribution is
S ~ N(46 x 25, 8 x root(25)) = N(1150, 40)
We use a calculator with
normalcdf(1100,999999,1150,40) = 0.89435
Problem 6
The manager of Wasabi restaurant tallied the number of customers that he received over a 50 day period. He found that the mean number per day for this period was 45 with a standard deviation of 8.
A. Construct a 95% confidence interval for the true mean.
Solution
First find the cast of characters:
![]()
Now put it into the calculator's TInterval to get: (42.726,47.274)
B. Write a sentence that explains your findings.
Solution
We can be 95% confident that the mean number of customers at Wasabi throughout the entire year is between 42.7 and 47.3.
C. Explain what it means in the context of this study to be 95% confident.
Solution
If many collections of 50 days of customer totals are looked at, different confidence intervals for each would be calculated. 95% of these confidence intervals would contain the true mean customer count for all days. 5% would not contain this mean.
D. Was it necessary to make any assumptions about the underlying distribution of the population? Explain.
Solution
No, we do not need to assume normality since n > 30.
Problem 7
A psychologist is doing research on blindly following orders. 200 volunteers were ordered to push a button that would inflict 50 volts of electricity into a laboratory animal. 35 of them refused to push the button.
A. Construct a 90% confidence interval for the true proportion of people who will refuse to zap the animal.
Solution
We first find the cast of characters:
n = 200, x = 35, cLevel = .90
Now put it into the calculator's 1-PropZInt to get: (0.13081,0.21919)B. Write a sentence that explains your findings.
Solution
We can be 90% confident that between 13% and 22% of all people would refuse to push a button to inflict 50 volts of electricity into a laboratory animal if ordered to.
C. Explain what it means in the context of this study to be 90% confident.
Solution
If many groups of 200 people are tested to see if they would refuse to push the button, different confidence intervals for each would be calculated. 90% of these confidence intervals would contain the true proportion of people who would refuse to push the button when ordered. 10% would not contain this proportion.
D. Was it necessary to make any assumptions about the underlying distribution of the population? Explain.
No, since npHat = 35 > 5 and nqHat = 165 > 5.
Problem 8
Nationally, 2% of the population carry a venereal
disease. You are interested in constructing a 95%
confidence interval for the mean number of carriers in the Tahoe Basin.
How many people will you need to test if you want a margin of error of
![]() 1%?
1%?
Solution
First find the cast of characters to find the sample size given a preliminary estimate for p.
p = 0.02, q = 0.98, E = 0.01, z = .196 (corresponds to a cLevel of .95)
Now plug it into the formula.
So we need to survey 753 people.
Problem 9
The amount of fuel that is used in a day by a
pizza delivery person is uniformly distributed between 1.5
and 12 gallons.
A. Write down the distribution.
Solution
The mean is (12 + 1.5)/2 = 6.75 and the standard deviation is the square root of (12 - 1.5)2 / 12 = 3.03. Therefore the distribution is
X ~ U(6.75,3.03)
B. Find the probability that on a randomly selected day the delivery
person will use between 5 and
10 gallons.
Solution
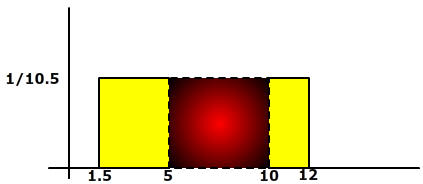
This is just the area of the rectangle
Base x Height = (10 - 5) x 1/(12 - 1.5) = 0.4762
C. Find the probability that on a randomly selected day the delivery
person will use between more than 5 gallons given
that less than 10 gallons was used.
Solution
We use conditional probability here.
P(A|B) = P(A and B) / P(B)
We have from part B,
P(A and B) = 0.4762
and
P(B) = (10 - 1.5) x 1/(12 - 1.5) = 0.8095
Now just divide to get
P(A|B) = 0.4762 / 0.8095 = 0.5883
D. Find the probability that the average fuel use on
45 days will be less than 6 gallons.
Solution
Since n > 30, we can use the Central Limit Theorem. We have that the mean has distribution
N(6.75,3.13/root(45)) = N(6.75,0.467)
Now just find
normalcdf(-9999,6,6.75,0.467) = 0.0541