Comparing Variances
We have spend a great deal of effort looking at the mean. Sometimes, it is the variance or the standard deviation that is more interesting. In particular, we will investigate whether two variances are different. In this case, it is natural to write down the null and alternative hypotheses
H0: s12 = s22
H1: s12
![]() s22
s22
Note that the alternative hypothesis can have the inequality ">" if we are interesting in showing that the first population has a larger variance than the second. By convention, we will always let s12 be the larger of the two sample variances. It turns out that the calculation of the test statistic is quite easy. The following theorem tells us how the compute the test statistic and what that test statistic is.
Theorem (Test Statistic for Comparing
Variances)
The test statistic for comparing variances is given by
s12
F =
s22
Where the statistic's distribution has n1 - 1 numerator degrees of freedom and n2 - 1 denominator degrees of freedom.
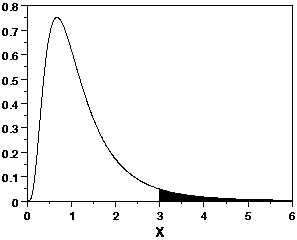
We have arrived at a distribution that we have not yet encountered, namely the "F" distribution. A table of values can be found in any statistic textbook and can be found in most statistical packages. We will show by example how to use the table for the F distribution. The graph of a typical F-distribution is shown to the right.
Example
A researcher wanted to see if women varied more than men in weight. Nine women and sixteen men were weighed. The variance for the women was 525 and the variance for the men was 142. What can be concluded at the 0.05 level of significance?
Solution
Since we are testing to see if the variance for the women is larger than the variance for the men, we let s1 be the women's sample variance and s2 the men's sample variance. The null and alternative hypotheses are
H0: s12 = s22
H1: s12 > s22
We compute the test statistic.
525
F =
= 3.70
142
with 9 - 1 = 8 numerator degrees of freedom and 16 - 1 = 15 denominator degrees of freedom.
Below we show an excerpt from the F distribution table.
| Degrees of freedom numerator, d.f.N | ||||||||||
| d.f.D | Right Tail Area | 1 | 2 | 3 | 4 | 5 | 6 | 7 | 8 | 9 |
| 0.100 | 3.07 | 2.70 | 2.49 | 2.36 | 2.27 | 2.21 | 2.16 | 2.12 | 2.09 | |
| 0.050 | 4.54 | 3.68 | 3.29 | 3.06 | 2.90 | 2.79 | 2.71 | 2.64 | 2.59 | |
| 15 | 0.025 | 6.20 | 4.77 | 4.15 | 3.80 | 3.58 | 3.41 | 3.29 | 3.20 | 3.12 |
| 0.010 | 8.68 | 6.36 | 5.42 | 4.89 | 4.56 | 4.32 | 4.14 | 4.00 | 3.89 | |
| 0.001 | 16.59 | 11.34 | 9.34 | 8.25 | 7.57 | 7.09 | 6.74 | 6.47 | 6.26 | |
This table shows the portion of the table with d.f.D = 15 and d.f.N between 1 and 9. We are interested in d.f.N = 8. The corresponding numbers are
2.12, 2.64, 3.20, 4.00, and 6.47
Since our F-score 3.70 lies between 3.20 and 4.00, the corresponding right tail areas are 0.025 and 0.010. Since this is a right tailed test, we can say that
0.010 < P < 0.025
In particular the P-value is less than the level of significance of 0.05. We can reject the null hypothesis and accept the alternative hypothesis. Hence, we have significant evidence to conclude that the variance for all female weights is larger than the variance for all male weights.
Example
I money fund manager is interested if the variance (from last year to this year) in the price of the stock of corporation that do business primarily in the East Coast is different from the variance for West Coast companies. The variance of the ten East Coast companies was found to be 26.15 and the variance for the 22 West Coast companies was found to be 9.68. What can be concluded at the 0.05 level of significance?
Solution
We first write down the null and alternative hypotheses
H0: s12 = s22
H1: s12
![]() s22
s22
Note that the first variable corresponds to the East Coast companies since it has a larger sample variance.
Now compute the test statistic.
26.15
F =
= 2.70
9.68
with 10 - 1 = 9 numerator degrees of freedom and 22 - 1 = 21 denominator degrees of freedom.
Since our F-score 2.70 lies between 2.37 and 2.80, the corresponding right tail areas are 0.050 and 0.025. Since this is a two tailed test, we need to double these numbers to get
0.050 < P < 0.100
In particular the P-value is greater than the level of significance of 0.05. We fail to reject the null hypothesis and say that there is insufficient evidence to make a conclusion about the variances being different. A larger study is needed if a conclusion is to be made.