Hint: The general box plot is shown below.
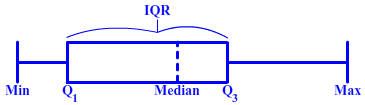
- The Min (minimum) corresponds to the lowest data value.
- Q1 (the first quartile) corresponds to the 25th percentile, or the value at which 25% of the data lies at or below this value.
- The Median corresponds to the 50th percentile or the middle value, or the value at which 50% of the data lies at or below this value.
- Q3 (the third quartile) corresponds to the 75th percentile, or the value at which 75% of the data lies at or below this value.
- The Max (maximum) corresponds to the highest data value.
- IQR (Inter-Quartile-Range) is the range for the middle 50% of the data.