Hints: Consider the diagram below and notice that there is a left tail and a right tail that must make a combined 0.05 area.
-
Use the fact that the sampling distribution (X distribution) has mean m and standard deviation s divided by the square root of n.
-
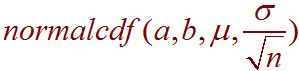
To find a probability that involves the mean use
-
a is the lower bound. Use -99999 if there is no lower bound (negative infinity).
-
b is the upper bound. Use 99999 if there is no upper bound (infinity).
-
m is the population mean
-
s is the population standard deviation
-
n is the sample size.
-
-
To find a percentile or quartile: Q1 = 25th percentile and Q3 = 75th percentile, use
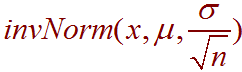 .
Other wordings are find the value such that 30% (x
= 0.3) of the data lies below the value. If you want to find
the value such that a given percentage lies above that value, use the rule
of complements. For example if 10%
lies above, then 90% lies below.
.
Other wordings are find the value such that 30% (x
= 0.3) of the data lies below the value. If you want to find
the value such that a given percentage lies above that value, use the rule
of complements. For example if 10%
lies above, then 90% lies below. -
Use the fact that the distribution of a sum of values has mean nm and standard deviation s times the square root of n.
-
To find a probability that involves the sum use

-
To find the Inter-Quartile-Range (IQR), find the first quartile (25th percentile) and the third quartile (75th percentile) and subtract.