Discrete Probability
General Definitions
When we think of probability we think of chance, such as the chance of flipping two heads in a row from two coin tosses, or the chance that a face card will come up in a deck of cards. The probability is a number that defines the "chance". We call all the possible outcomes such as HH, HT, TH, TT for flipping two coins the sample space. Each of these four are called outcomes, and any individual one or collection of individual ones is called and event. A simple event is an individual outcome
Example
Suppose that you toss two six sided dice and are interested in getting a sum of a 9. Then there are 36 simple events in this experiment, since there are six for the first die and for each of these six, there are six possibilities for the second die. There are 3 simple events in the event of rolling a 9: (3,6), (4,5), and (6,3).
Discrete Random Variables and Probability
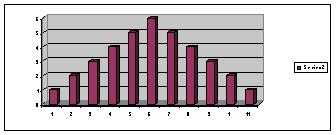
A function that assigns a number to each outcome is called a random variable. Random variables usually are the results of experiments, observations, or surveys. A random variable that has a finite number of outcomes is a discrete random variable. The definition of discrete random variable actually included more than just finite outcomes, but we will not go into the details here. If the experiment is repeated many times then each event may occur more than once. The number of times an event occurs is called the frequency of the event. We can use frequency distribution tables, bar graphs, and pie charts to visually represent all the frequencies of the events. The bar graph shows the theoretical frequencies corresponding to the sum of two dice.

We define the probability of an event as the number of simple events within the event divided by the number of simple events in the sample space. If E is the event and S is the sample space, then
#E
P(E) =
#S
Example
To find the probability of rolling a sum of 9 from two dice, we see that there are 3 ways of rolling a 9 and 36 ways of rolling, hence
P(9) = 3/36 = 1/12
We often make a table of the probabilities all the possible events of a type. This is called a probability distribution table. For example below is a table of the probabilities of all the possible sums of two dice.
| x | 2 | 3 | 4 | 5 | 6 | 7 | 8 | 9 | 10 | 11 | 12 |
| P(x) | 1/36 | 1/18 | 1/12 | 1/9 | 5/36 | 1/6 | 5/36 | 1/9 | 1/12 | 1/18 | 1/36 |
Expected Value
If you are a casino manager and are looking into hosting a new game, you are interested in the bottom line. If many people play the game many times how much money do you expect to collect on the average per game. This is the idea of expected value. More formally,
If x1, x2, ..., xn are the possible outcomes and P(x1), P(x2), ..., P(xn) are the corresponding probabilities, then the expected value is given by
m = E(x) = x1P(x1) + x2P(x2) + ... + xnP(n1)
Example
Your club is holding a raffle where you are selling 1000 tickets. Each ticket costs $5. There will be one first place prize of $2000, 5 second place prizes of $500, and 10 third place prizes of $100. What is the expected value?
Solution
We first create a probability distribution table. Notice that the first place prize nets $995 since the prize is $1000 and the fee is $5. Also there are 984 tickets that net -5 dollars.
| x | 1995 | 495 | 95 | -5 |
| P(x) | 1/1000 | 5/1000 | 10/1000 | 984/1000 |
Now we are ready to compute the expected value.
E(x) = (1995)(1/1000) + (495)(5/1000) + 95(10/1000) + (-5)(984/1000)
= 500/1000 = 0.5.
We say that the expected gain for each ticket is fifty cents.
Variance and Standard Deviation
The expected value gives the trend in the long run. What if you are concerned about large wins and large losses at each individual trial? The variance and standard deviation are measures of how many of simple events are far from the expected value. We use the following formula. The variance is given by
V(x) = (x1 -m)2P(x1) + (x2 -m)2P(x2) + ... + (xn -m)2P(n1)
The standard deviation s is the square root of the variance.
![]()
Example
Compute the standard deviation of the raffle example above.
Solution
We have
V(x) = (1995 - 0.5)2(1/1000) + (495 - 0.5)2(5/1000) + (95 - 0.5)2(10/1000) + (-5 - 0.5)2(984/1000)
= 5319.75
The standard deviation is just the square root of this number or
s = 72.94
Back to the Math 117 Home Page
Back to the Math Department Home
e-mail Questions and Suggestions