The Least Squares Regression Line
Example:
Suppose you have three points in the plane and want to find the line
y = mx + b
that is closest to the points. Then we want to minimize the sum of the squares
of the vertical distances, that is find m and b
such that
d12 +
d22 + d32
is minimum. We call the equation
y = mx + b
the least squares regression line. We
calculate
d12 +
d22 + d32 = f = [y1
- (mx1+ b)]2 + [y2 - (mx2+ b)]2
+ [y3 - (mx3+ b)]2
To minimize we take derivatives to get
fm
= 2[y1 - (mx1+ b)](-x1) + 2[y2
- (mx2+ b)](-x2) + 2[y3 - (mx3+
b)](-x3) = 0
and
fb =
-2[y1 - (mx1+ b)] - 2[y2 - (mx2+
b)] - 2[y3 - (mx3+ b)] = 0
We have
-
x1(y1 - (mx1+ b)) + x2(y2 - (mx2+ b)) + x3(y3 - (mx3+ b)) = 0
-
(y1 - (mx1+ b)) + (y2 - (mx2+ b)) + (y3 - (mx3+ b)) = 0
In S notation, we have
-
Sxiyi - mSxi2 - bSxi = 0
-
Syi - mSxi - nb = 0
Notice here n = 3 since there are three points. These equations work for an arbitrary number of points.
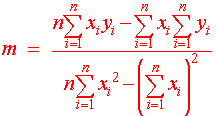
We can solve to get
|
|
Exercise: Find the equation of the regression line for
(3,2), (5,1) and (4,3)
Fortunately, many calculators and computer programs can find the equation of the regression line. In particular, the TI 89 can be used by going to "Apps", Data/Matrix Editor, enter the data and then go to calc.
Application
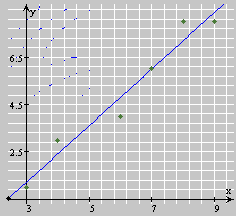
A biologist has run seven experiments with different amounts of nitrogen and bacteria growth. The data is shown below
| grams of N | 3 | 4 | 6 | 7 | 8 | 9 |
| g of bacteria | 1 | 3 | 4 | 6 | 8 | 8 |
Find the equation of the least squares regression line using a calculator. What would you estimate for the amount of bacteria given 5 grams of N?
Solution
Using a computer, we obtained
y = -2.35 + 1.19x
Plugging 5 into the equation gives
y = -2.35 + 1.19(5) = 3.6
We estimate that there will be about 3.6 grams of bacteria in an environment of 5 grams of nitrogen. The picture below shows the scatter plot and the points.

Least Squares Regression Quadratic
A line is not always the best model for a set of data. Often theory or a quick look at the plotted points predict that the data can be best modeled by a nonlinear function. We will not get into the details here, but the technique of finding the extrema can be used for any model. Again, machines are especially useful for finding the proper coefficients.
Example
You own an umbrella rental shop by the beach and have collected data on the number of customers at each hour of operation. You expect that typically, your business begins slow, peaks in the middle of the day and then slows down as the day finishes. Hence you expect that a parabola may be the best model for your business. The table below shows the number of customers on a Saturday in August.
| Military Time | 8:00 | 10:00 | 12:00 | 14:00 | 16:00 |
| Customers | 3 | 15 | 25 | 8 | 2 |
Use a machine to come up with a least squares regression quadratic and then estimate the number of customers at the 11:00 hour.
Solution
A machine gives
y = .59x2 - 6.48x + 18.45
Plugging in 11, gives 18.75 or about 19 customers.
Back to the Math 117 Home Page
Back to the Math Department Home
e-mail Questions and Suggestions

