Graphing
The Distance Formula
If two points are in the plane, we can find the distance between them by using the Pythagorean theorem. For example, if the points are (1,4) and (5,2), then the the figure below shows the right triangle that helps us find the distance.

We have
s2 = (5 - 1)2 + (4 - 2)2 = 42 + 22 = 20
So that
s =
![]()
In general
|
|
Graphing Equations
If an equation is given, we can find the x-intercept by setting y equal to zero and solving. We can find the y-intercept by setting x equal to zero and solving.
Example
Find the x and y intercepts of
y2 = x3 - 4x
Solution
Let's first find the y-intercept. Setting x equal to zero gives
y2 = 03 - 4(0) = 0
Hence the y-intercept is at (0,0).
Now find the x-intercept. Setting y equal to 0 gives
0 = x3 - 4x
x(x2 - 4) = x(x - 2)(x + 2) = 0 Factoring
x = 0 or x = -2 or x = 2
Hence the x-intercepts are at the points
(-2,0), (0,0), and (2,0)
Notice that the origin is both an x and y intercept.
Supply and Demand
Economists are interested in the study of supply and demand.
The supply curve is the relationship between the price at which an item is sold and the quantity that suppliers are willing to sell in their store.
The demand curve is the relationship between the price at which an item is sold and the number is items that will be purchased by consumers.
If the price is lowered, then fewer suppliers will be interested in selling the item while more consumers will be interested in purchasing the item. The price will be be adjusted so that the number of items sold in stores will equal the number of items that the customer is willing to purchase. This point is called the equilibrium point.
Example
Suppose that the demand curve for snow board rentals is given by
p = 20 + 4x
and the supply curve is given by
p = 300 - 10x
Find the equilibrium point.
Solution
We want to find the point of intersection. Setting the equations equal to each other gives
20 + 4x = 300 - 10x
14x = 280 adding 10x and subtracting 20
x = 20 dividing by 14
Now plug this back into the demand equation
p = 40 + 4(20) = 100
The equilibrium points is (20,100). That is the market will be in equilibrium when the price of a rental is $20 when there will 100 snowboards rented.
Mathematical Modeling
When data is collected, it typically does not fit any simple equation perfectly. However, the data often can be approximated by a rather simple curve. The type of curve can be determine by either glancing at the data and searching for a pattern or from theoretical considerations of where the data come from. Once the type of curve has been determined, mathematics can be used to find the "best" curve of the given type. The determination of the best curve involved more advanced mathematics so will not be discussed at this time.
Example A Mathematical Model
A biologist has collected data of the weight of a dog over time. She weighed the animal each week over a period of 5 weeks. The data is given below
| Week | 0 | 1 | 2 | 3 | 4 | 5 |
| Weight | 1.5 | 2.0 | 2.3 | 2.5 | 2.7 | 2.8 |
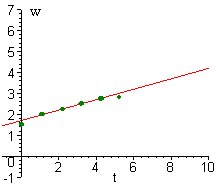
The best linear model for this data is given by
w = 1.7 + .25t
where w is the weight of the dog and t is the time in weeks. The graph of the line and the scatter plot is shown below.

We can see that the data is close to the line. If we want to predict the weight of the dog at week 8 we can use the model
w(8) = 1.7 + .25(8) = 3.7
We can predict that the dog will weigh about 3.7 pounds at week 8.
Back to the calculus home page
Back to the math department home page
e-mail Questions and Suggestions