Practice Exam II
No Calculator Part
Problem 1: Graph the following functions
A. 
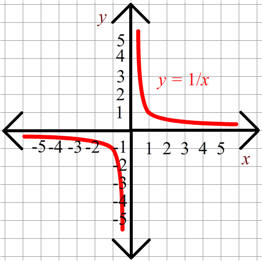
Solution: This is one that you are suspected to have memorized. The graph is shown below.
B. ![]()
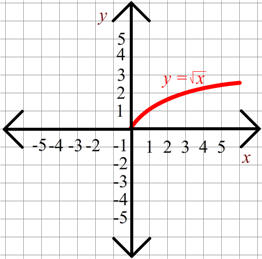
Solution: This graph is also supposed to be memorized. The graph is shown below.
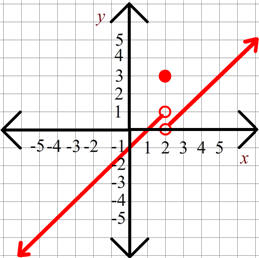
C.
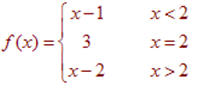
Solution: This is a piecewise function with a ray to the left from (2,1), a solid dot at (2,3), and a ray to the right from (2,0).
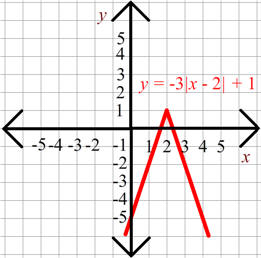
D. ![]()
Solution: This is an absolute value graph in the shape of a "V". The "-" makes it go upside down. The vertex is at the point (2,1). The "3" stretches it to slope 3 and -3.
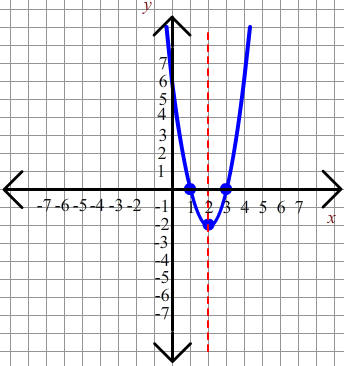
Problem 2: Determine the intercepts, vertex, and axis of symmetry. Then use this information to sketch the graph.
![]()
Solution
To find the y-intercept just plug in x = 0 to get:
y-intercept: (0,6)
To find the x-intercepts, plug in 0 for y to get:
0 = 2x2 - 8x + 6
Now factor to get
0 = 2(x-3)(x-1)
This has solution x = 3 or x = 1. The x-intercepts are at:
x-intercepts: (1,0) and (3,0)
To find the x-coordinate of the vertex, computeThe axis of symmetry is at the x-coordinate of the vertex, that is
We can use all all of the info above to get the graph shown below:
Problem 3: Solve the inequality.
![]()
First subtract 7x from both sides to set the right hand side equal to 0.
x2 - 7x + 6 > 0
Next factor
(x-1)(x-6) > 0
The key values of x are:
x = 1 and x
= 6
Next place these values on the number line. Place a parabola that is concave up (since the coefficient of x2 is positive).
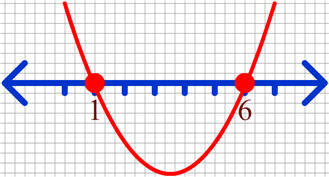
Since we want the part that is greater than or equal to 0, the solution is the outside pieces or
![]()
Problem 4: Consider the polynomial below.
![]()
A. List the real zeros and multiplicities
Solution
The zeros are when the function is equal to zero and the multiplicities are the powers. Hence the zeros are at:
x = 0: Multiplicity 1
x = -1: Multiplicity 2
x = 1: Multiplicity 3
B. Determine whether the graph crosses or touches the x-axis at each x-intercept.
Solution
The graph will cross the x-axis if the multiplicity is odd. So the graph crosses the x-axis at x = 0 and at x = 1. The graph touches the x-axis at x = -1.
C. Determine the maximum number of turning points on the graph.
Solution
Since the degree of the polynomial is 6 = (1+2+3), the graph has at most 5 turning points.
D. Determine the behavior. That is, find the power function that the graph of f resembles for large values of |x|.
Solution
The behavior of the graph look like the highest degree term. The highest degree term is x6. Thus it decreases steeply downward from above at the far left and it increases steeply upwards at the far right.
Calculator Part
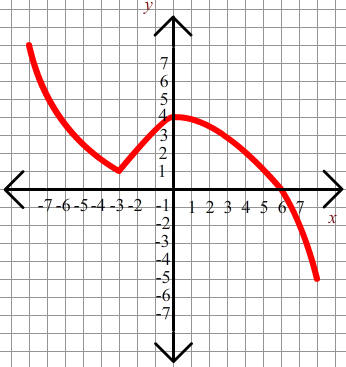
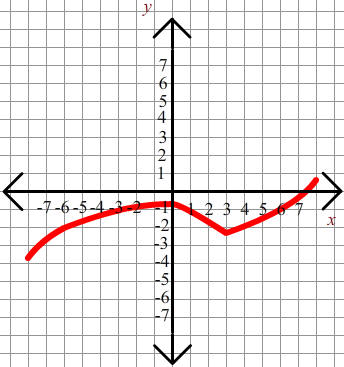
Problem 5: Shown below is the graph of y = f (x). Sketch the graph of y = 1/3 f (-x) - 2.
Solution
The key points of this graph are (-3,-1), (0,4) and (6,0). The corresponding points of the new graph are (3,-2 1/3), (0,-2/3), and (-6,-2). These are either obtained from plugging into the new function or from first reflecting across the y-axis then dividing by 3 and then adding 2. The shape will include a reflection across a vertical line, a scale by 1/3 and a shift down by 2. The graph is shown below.
Problem 6: A rectangle is inscribed in a semicircle of radius 4 as shown below. Let P = (x,y) be the point in the first quadrant that is a vertex of the rectangle and is on the circle.
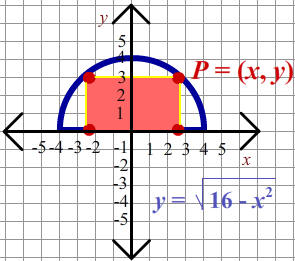
A. Express the area A of the rectangle as a function of x.
Solution:
Since the area of a rectangle is the base times the height, we note that the base is 2x and the height is y which is the square root of (16 -x2). Now the area is
![]()
B. Express the perimeter p of the rectangle as a function of x.
Solution
The perimeter is the sum of the sides. The base is 2x and the height is the square root of (9 -x2). Thus the perimeter is
![]()
C. For what value of x is A the largest? What is this largest A?
Solution
For this question, we can use our calculator to graph the function and then use the maximum feature to find that this occurs at approximately x = 2.828 and A = 16.
.
D. For what value of x is p the largest? What is the largest p?
Solution
For this question, we can use our calculator to graph the function and then use the maximum feature to find that this occurs at approximately x = 3.58 and p = 17.89.
Problem 7: The two data sets below represent two different runner's distances (in miles) vs. time (in seconds). For each of them sketch the graph of the scatter diagram. Then determine if a linear model or a quadratic model best describes the graph. Sketch these best fitting curve on the scatter diagram. If it is a line, interpret the slope. Then use your model to predict the times of each for a distance of 6 miles.
| First Runner | Second Runner | ||||||||||||||||||||||||||||||||||||||||||||||
|
|
Solution
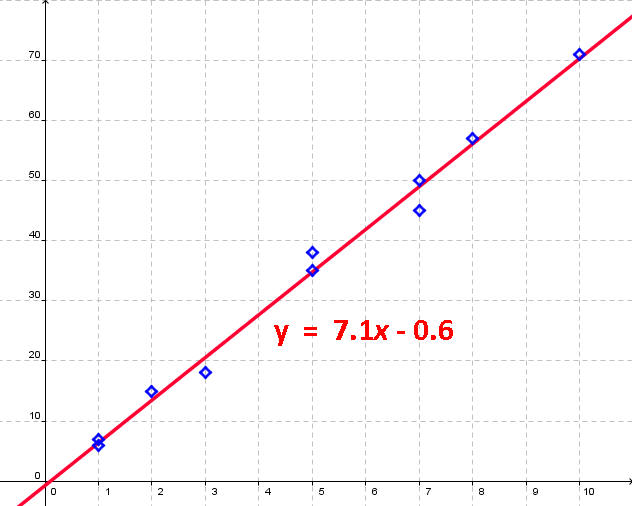
The first runners scatter plot is shown below. Since the points nearly lie on a line, we use a linear regression line. To predict the runner's time at 6 miles, we plug in 6 into the linear equation to get:
Time = (7.1)(6) - 0.6 = 42
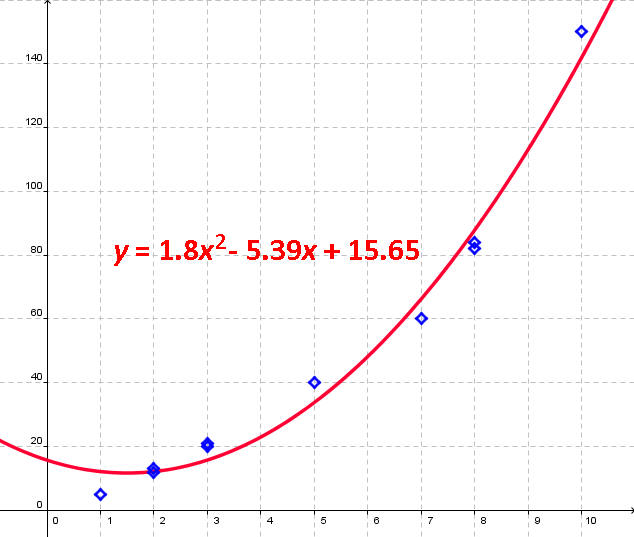
Notice that the scatter plot for the second data set is not close to linear but is close to being parabola shaped. We use a quadratic regression curve as shown below. The equation of the quadratic is
Time = 1.8x2 - 5.39x + 15.65 = 48.4
Problem 8: The demand equation for selling x liters of fresh carrot juice at a health food store at a price of p dollars is given by
x(p) = -6p + 50
A. Find the revenue as a function of p.
Solution
The revenue is equal to the amount sold x times the price p. Thus,
R(x) = (-6p + 50)p = -6p2 + 50p
B. What price should the store sell the juice in order to maximize revenue?
SolutionWe can use a calculator to solve this or we can just find the vertex of the parabola using the -b/2a formula. We have that the maximum revenue occurs at the price
p = -50/2(-6)
This is about $4.17 per liter.
C. Use your calculator's graphing capabilities to determine the range prices that produces a revenue greater than $20.
Solution
Set
R(x) = -6p2 + 50p > 20
or
-6p2 + 50p - 20 > 0
We can use the calculator to approximate the roots: p = 0.42 and p = 7.92.
Since the graph is concave down, the region between these two values will contain the vertex. Thus the price range for revenue greater than $20 is
(0.42, 7.92)