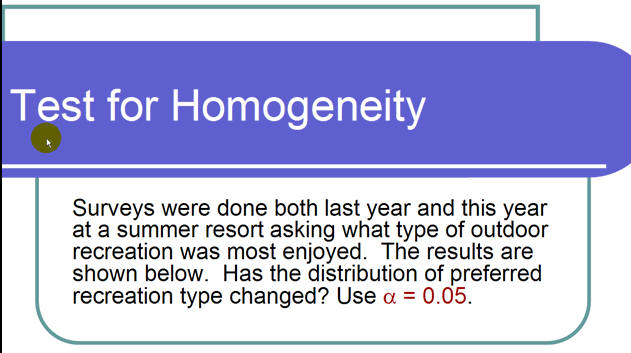
Test for Homogeneity
Summary: This module describes how the chi-square distribution can be used to test for homogeneity.
The Goodness of Fit test can be used to decide whether a population fits a given distribution, but the Goodness of Fit test will not suffice to compare whether two populations follow the same unknown distribution. A different test, called the Test for Homogeneity, can be used to make a conclusion about whether two populations have the same distribution. To calculate the test statistic for a test for homogeneity, follow the same procedure as with the c2 test for independence.
Here is a summary of the Test for Homogeneity:
Hypotheses
H0: The distributions of the two
populations are the same.
Ha: The distributions of the two populations are not the
same.
Test Statistic
Uses a c2 statistic. It is computed in the same way as the test for independence.
Requirements
All values in the table must be greater than or equal to 5.
Common Uses
Comparing two populations. For example: men vs women, before vs. after, east vs. west.
The variable is categorical with more than two possible response values.
|
EXAMPLE 1 Do male and female college students have the same distribution of living conditions? Use a level of significance of 0.05. Suppose that 250 randomly selected male college students and 300 randomly selected female college students were asked about their living conditions: Dorm, Apartment, With Parents, Other. The results are shown in the table below:
Solution The null and alternative hypotheses are:
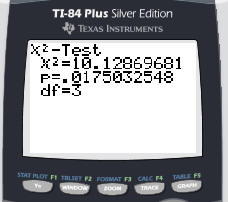
To compute the test statistic, follow the same
process as with the test for independence. Here there are 2 rows
and 4 columns. Note that the degrees of freedom for this test is To the right is the readout from a TI 84+. p-value = 0.0175 < 0.05 = Level of Significance Therefore, reject the null hypothesis and accept the alternative hypothesis. You can conclude that the distributions of living conditions for male and female college students are not the same. Notice that the conclusion is only that the
distributions are not the same. One cannot use the test for
homogeneity to make any conclusions about how they differ. |
 The
The |
EXAMPLE 2 Both before and after a recent earthquake surveys were conducted asking voters which of the three candidates they planned on voting for in the upcoming city council election. Has there been a change since the earthquake? Use a level of significance of 0.05. The table below shows the results of the survey.
Solution The null and alternative hypotheses are: This table has 2 rows
and 3 columns. The degrees of freedom for this test is To the right is the readout from a TI 84+. The c2 test statistic is about 3.26 and the p-value is 0.196. The inequality is p-value = 0.196 > 0.05 = Level of Significance Therefore, fail to reject the null hypothesis.
There is insufficient evidence to make a conclusion about whether the
distribution of voter preferences differs before and after the
earthquake. |
||||||||||||||||
Summary of a c2-Tests
You have seen the a c2 test statistic used in three different circumstances. Below is a summary that will help you decide which c2 test is the appropriate one to use.
- Goodness of Fit: Use the Goodness of Fit Test
when you want to decide whether a population with unknown distribution
"fits" a known distribution. In this case there will be a single
qualitative survey question or a single outcome of an experiment from a
single population. Goodness of fit is typically used to see if the
population is uniform (all outcomes occur with equal frequency), the
population is normal, or the population is the same as another population
with known distribution. The null and alternative hypotheses are:
- H0: The population fits the given distribution.
- Ha: The population does not fit the given
distribution.
- Independence: Use the Test for Independence when
you want to decide whether two variables are independent or dependent.
In this case there will be two qualitative survey questions or experiments
and a contingency table will be constructed. The goal is to see if the
two variables are unrelated (independent) or related (dependent). The
null and alternative hypotheses are:
- H0: The two variables are independent.
- Ha: The two variables are dependent.
- Homogeneity: Use the Test for Homogeneity when
you want to decide if two populations with unknown distribution have the
same distribution as each other. In this case there will be a single
qualitative survey question or experiment given to two different
populations. The null and alternative hypotheses are:
- H0: The two populations follow the same distribution.
- Ha: The two populations have different distributions.