How to graph the line
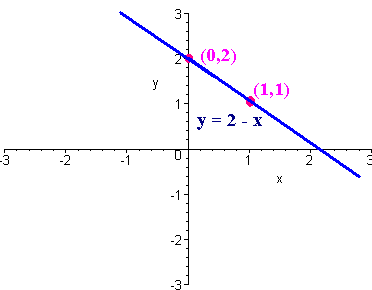
y = 2 - x
Step 1: Make a T table with two points. The values 0 and 1 are usually convenient, although other choices are fine here. Notice that
For x = 0:
y = 2 - 0 = 2
For x = 1:
y = 2 - 1 = 1
We can now make the table below
| x | y |
| 0 | 2 |
| 1 | 1 |
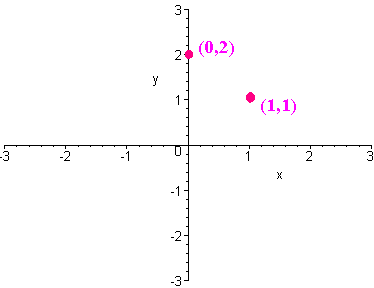
This indicates the points
(0,2) and (1,1)
Step 2 Plot the two points on the xy-plane. Graph paper would be useful here.

Step 3
Connect the dots with a line using a ruler

e-mail Questions and Suggestions