Limits a Geometric and Numeric Approach
Limits Using TablesConsider the function
x2 - 1
f(x) =
x + 1
Notice that this function is undefined at x = -1. In calculus undefined is not as precise as possible. Instead one asks, what does the y value "look like" when the x value is near -1. The table below demonstrates:
| x | -0.9 | -1.1 | -0.99 | -1.01 | -0.999 | -1.001 |
| y | -1.9 | -2.1 | -1.99 | -2.01 | -1.999 | -2.001 |
We see that if x is close to -1, then
f(x) is close to -2. We say
"The
limit of f(x) as x approaches
-1 is -2" and write
![]()
If the y value does not tend toward a single number as
x tends towards a,
then we say that the limit does not exist as x approaches
a.
Exercise
Use a table to find the following limit if it exists.
![]()
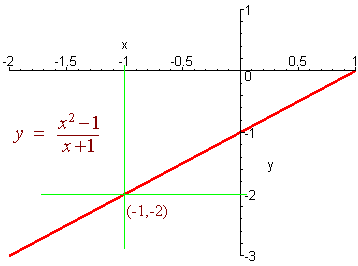
Looking at the graph of a function is another convenient way of determining a limit. For example, a computer was used to graph the the function
x2 - 1
f(x) =
x + 1

Notice that the computer indicates that the y value approaches -2 as the
x value approaches -1. In fact, the computer ignores the fact that
the function is undefined at x = -1.
Exercise:
Use a graphing calculator to find the limits from
the prior exercise if they exist.
Choose a function and a number. Let partner A select a y range.
Partner B must find an x range so that the graph leaves the box on
the sides and not the top and bottom. If Partner B can always win,
then the function has a limit at that number. We will play this game
first with me as Partner B and the class as Partner A.
Other Sites About Limits
Weisstein's World of Mathematics