Math
201
Practice
Midterm I
Please work out each of the given
problems. Credit will be based on
the steps that you show towards the final answer.
Show your work.
Problem 1 Categorize these measurements associated with Lake Tahoe according to level:
nominal, ordinal, interval, or ratio.
-
The depth of clarity of the lake.
-
The time at which the first boat passes through from the Keys.
-
The type of fish that is the first to be caught in the morning.
A. Ratio, It makes sense to say that the depth has decreased by a factor of two.
B. Interval, It makes sense to say that today's time was 15 minutes later than yesterday's, but it does not make sense to say that the time was twice yesterday's.
C. Nominal, possible outcomes are Cutthroat, Kokanee, Rainbow, etc. which are qualitative.
Problem
2
You are interested in finding out the average number of classes that students take at LTCC. Since you can't find out this information for every student, you have all instructors who teach at 10:00 AM to survey all of their classes.
A. Is this a random sample? Explain your reasoning.
B. What type of sampling is this?
A. No, for example, none of the students will be night students who are less likely to take a full load.
B. This is cluster sampling since all of one area are surveyed.
Problem 3
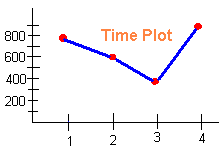
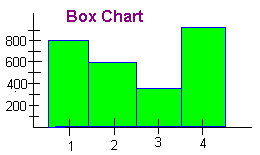
A. You did research to determine the number of snow boarders who rode Sierra each Wednesday in January. You came up with the following data.
| Week | 1 | 2 | 3 | 4 |
| No. of Boarders | 800 | 600 | 400 | 900 |
Construct a time plot and a bar chart for this data.


Problem
4
You are interested in the distribution of tree size in the Lake Tahoe basin. You take a random sample of 24 trees and measure their diameters (in inches). Below is the data that you collected.
0 3 4 4 6 7 8 8 9 10 10 10 11 12 14
16 17 19 24 24 29 30 34 39
A. Make a frequency table and histogram for this data. Use 4 class intervals
We make the class intervals 0-9 10-19 20-29 30-39
| Class | 0-9 | 10-19 | 20-29 | 30-39 |
| Frequency | 9 | 9 | 3 | 3 |
B. Make a Stem and Leaf Display of this data.
0 || 0 3 4 4 6 7 8 8 9
1 || 0 0 0 1 2 4 6 7 9
2 || 4 4 9
3 || 0 4 9
C. Describe the distribution of the data using the language of statistics.
The distribution is skewed to the right.
D. If a 25th tree was found to have a diameter of 48 inches would the standard deviation increase or decrease. (Answer this without calculating)
It would increase, since the standard deviation measures the spread of the data, adding a 48 would increase the spread. (48 is clearly very far from the mean.)
E. In what percentile is the tree that has a diameter of 7 inches?
There are 24 in the sample and there are 6 at or below the number 7. We compute
6
100% = 25th percentile
24
Problem 5
Twenty students were asked how far they travelled each day to get to the college. Nineteen of the students all traveled between 0 and 7 miles, but one student lived in Sacramento and traveled 100 miles each day.
A. Which of the following would be changed significantly if the student from Sacramento had not been surveyed: mean, median, mode, standard deviation, variance, 5% trimmed mean?Solution
The mean, standard deviation, and variance are all affected by outliers.
B. Suppose that the student from Sacramento had not been surveyed and that the mean was calculated to be 3.2 and the standard deviation was 0.9. Use a sentence or two to interpret the standard deviation in the context of the study.
Solution
Since the mean is 3.2 and the standard deviation is 0.9, we can say that generally much of the data most likely lies within one standard deviation of the mean. Subtracting 0.9 from 3.2 gives 2.3 and adding 0.9 to 3.2 gives 4.1. Thus a good percent of the students travel between 2.3 and 4.1 miles to the college each day.
Problem 6
Last year, 2,000,000 Kokanee Salmon hatched in Taylor Creek. Of those, only 20,000 reached to one year. 12,000 of the survivors were female.
A. What is the estimated probability that a hatched egg will live for at least one year?
20000/2000000 = .01
B. What is the estimated probability that a Kokanee that lives to one year will be female?
12000/20000 = .6
C. What is the estimated probability that a hatched egg will live for at least one year and will be female?
12000/2000000 = .006
D. Estimate the probability that a hatched egg will die before it reaches one year old?
We use the property of complements
P(Not living 1 year) = 1 - P(living 1 year) = 1 - .01 = .99
Problem 7
You roll two fair six sided dice.
A. What is the probability that the sum of the two dice is four?
The sample space has 36 elements (six possibilities for each die). You can get a four by
1 and 3, 3 and 1, and 2 and 2
hence
P(Sum = 4) = 3/36 = 1/12
B. What is the probability that the sum of the two dice is a nine given that the first die was a six?
Since we are given the value of the first die, we only need to determine the second die. There are 6 values for the second die. The only way to roll a sum of nine while the first die shows a six is for the second die to be a 3. We have
P(Sum = 9| First = 6) = 1/6
C. What is the probability that the sum of the two dice is larger than 3?
The easiest way to do this one is to use complements.
P(Sum > 3) = 1 - P(Sum < 3) = 1 - P(Sum = 3) - P(Sum = 2)
The only way to roll a sum of 3 is
1 and 2 and 2 and 1
hence
P(Sum = 3) = 2/36
The only way to roll a sum of 2 is
1 and 1
hence
P(Sum = 2) = 1/36
We compute
1 - P(Sum = 3) - P(Sum = 2) = 1 - 2/36 - 1/36 = 33/36 = 11/12
Problem 8
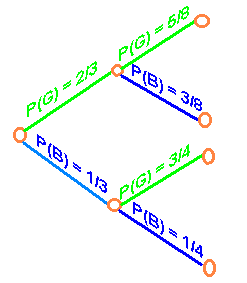
In your collection of nine pens you know that three are out of ink. Since you are in a rush to get to your midterm, you randomly select two of the pens (a blue one and a black one).
A. Draw a tree diagram for the outcomes of this experiment. Show the probabilities of each stage on the appropriate branch.
Let
G = Good pen with ink
B = Bad pen without ink
below is the tree diagram

B. Use the tree diagram to determine that probability that at exactly one of the pens is not out of ink.
We see that there are two leaves corresponding to exactly one of the pens out of ink. We can first select a good one then a bad one or we can select a bad one then a good one.
P(First is good and second is bad) = (2/3)(3/8) = 1/4
P(First is bad and one is good) = (1/3)(3/4) = 1/4
We add these probabilities to get
P(exactly one good) = 1/4 + 1/4 = 1/2
Problem 9
Determine the probability of getting a Royal Flush in Poker (5 card stud). (Recall that a Royal Flush is Ace King Queen Jack and Ten all in the same suit. Also recall that there are 52 cards in a deck and a poker hand has five cards.
There are four ways to get a Royal Flush (one for each suit). We use combinations to find the total number 5 card hands. We have
C52,5 = 2,598,960
The probability is
P(Royal Flush) = 4/2,598,960 = .0000015
Problem 10
You are the manager of the chicken and steak house restaurant which has two items on the menu: the chicken dinner and the steak dinner. 30% of your customers order steak. If you have 15 customers this evening, what is the probability that exactly 5 of them will order steak?
This is a binomial distribution. We want the probability of 5 successes out of 15 trials. We have
P(5 successes) = C15,5 (.3)5 (.7)10 = .206
Extra Credit: Write down one thing that your instructor can do to make the class better and one thing that you feel that the instructor should continue doing.
(Any constructive remarks will be worth full credit.)